

You’ve got the apps. The CRM. The quoting tool. The industry-specific platform that’s been “mission-critical” since 2012. Maybe a project tracker you think your team is probably using. But here’s the problem: none of it’s connected. Some of it’s confusing. And nobody’s entirely sure if you’re using 10% or 90% of the features you’re paying for. That’s where a good MSP (like us!) comes in. 1. We Help You Pick the Right Tools in the First Place Ever picked a line-of-business app because “someone on Reddit said it was good”? We’ve seen it. The truth is: not all tools are created equal, and definitely not all of them are the right fit for your workflow, team size, budget, or industry. At Techstra, we help you: Understand what features you actually need Compare tools that align with your goals Avoid wasting money on bloated software that sounds great but delivers headaches Pick vendors who won’t ghost you the minute something breaks Because tech is only powerful if it fits. 2. We Speak Fluent “Vendor” If calling support for your business app feels like being transferred to five different departments and ending up nowhere (yeah, we’ve been there). Let us handle that. We interface directly with your software vendors to: Get technical issues escalated and resolved Ask the right questions (before things go sideways) Negotiate better licensing terms or clarify confusing contracts Ensure you’re getting every ounce of value you’re paying for We deal with the vendors so you don’t have to. Go ahead and delete that 1-800 support number from your phone. 3. We Unlock Hidden Features (That You Already Pay For) Most small businesses only use a fraction of the tools they license, because nobody has time to learn them inside out. We do. Efficiency starts with optimization. We’ll help you: Enable the right integrations Set up automation workflows that tie apps together Uncover features that reduce manual entry, double work, or repetitive admin tasks Train your team to actually use the good stuff Think of us as your personal software whisperers. 4. We Integrate Everything Into Your Tech Ecosystem Your tools shouldn’t live in silos. We help integrate your LOB apps into the rest of your systems: Link your CRM to your quoting platform Tie email tools into your helpdesk Sync project data to billing Automate status updates across departments Ensure everything plays nicely with your cloud environment and security policies The result? Less chaos. More clarity. And way less “Where did that lead go?” moments. 5. We Keep It Running Smoothly Software needs love. Vendors change features, APIs break, users forget best practices.. and that’s where we shine. With Techstra in your corner, you get: Ongoing monitoring Configuration updates Automation tweaks Support when new tools are added Guidance when your needs evolve Because business doesn’t stand still. Neither should your tech. Let’s Get More Out of What You Already Have You don’t need to spend more on new tools. You need to get more from the ones you already pay for. Our Free IT & App Ecosystem Assessment shows you where your software can work harder, smarter, and more connected. Let’s turn your stack into a superpower. 📧 sales@techstra.co | 📞 (385) 270-9170 One partner. One ecosystem. All your tools, finally working together. Because “we already have that tool” doesn’t mean it’s doing its job. Let’s make sure it is.

If you’ve ever looked at the fancy tech that big companies use - it is AI-driven everything, cloud-powered analytics, zero-trust security frameworks - and had the thought, “Cool, but I can’t afford that,” we’ve got news: That’s changing. Fast. Thanks to smarter tools, more competition, and managed service providers (like us!), the kind of technology once reserved for Fortune 500s is now within reach of your 10-person shop, your startup, or your rapidly growing family business. So what’s coming—and how can you actually use it? Let’s take a look. 1. Artificial Intelligence (But Make It Useful) No, not the creepy robot takeover kind. We’re talking everyday AI : Tools that summarize meetings and emails Smart customer service chatbots that actually help people Predictive analytics to help you know when your customers are ready to buy Voice-to-text for phone calls, meetings, and brainstorming sessions Small businesses are already using AI to save time, improve decisions, and make work suck less . You don’t need to train your own model, you just need someone to hook you up with the right tools (🙋♂️). 2. Cloud Tools That Don’t Suck The cloud used to be scary. Now it’s just… necessary. But the good news? Modern cloud platforms are: Easier to use More affordable Way more secure than your in-office “server closet” with the dusty fan and constant hum Whether it’s cloud file storage , cloud-based phone systems , or fully virtual desktops , you can now work from anywhere without sacrificing speed, performance, or security. (Your “work from cabin” dream just got real.) 3. Security That Doesn’t Need a Full-Time CISO Cybersecurity is no longer “optional”, but that doesn’t mean it has to be expensive or complex. Emerging security tech includes: EDR (Endpoint Detection and Response) with AI threat detection Zero-trust architecture without needing a $200K/year security engineer Managed Security Operations Centers (like ours) that run 24/7 so you don’t have to What the means for you: Big company protection, small business price tag. 4. Process Automation for Mere Mortals Think you need to hire a developer to automate your onboarding process, sales pipeline, or invoice reminders? Nope. Tools like n8n, Zapier, and Microsoft Power Automate are leveling the playing field. We’re helping businesses just like yours: Auto-assign tasks when a new deal is closed Trigger follow-up emails based on activity Keep CRM and project systems in sync automatically Automation used to be a luxury. Now? It’s just smart business. 5. Unified Communications That Aren’t a Mess You used to need a dozen apps to run your business. Now? You can have: Phones Chat Video calls File sharing Project collaboration …all in one place. Microsoft Teams, Slack + integrations, or even a cloud-based VoIP system can centralize your tech life and save your team from constant “Where was that file again?” syndrome. 6. Your MSP Is Your Secret Weapon Here’s the catch: You don’t need to buy, build, or learn all of this yourself. That’s what Techstra is for. We help small businesses adopt enterprise-grade technology without the enterprise-grade headaches. You get: Strategy (so you know what’s worth investing in) Deployment (so it actually works) Management (so you don’t have to babysit it) Support (from real humans, not bots with attitude problems) Ready to Future-Proof Your Business? Let’s talk about what’s on the horizon, and what makes sense for your business right now . We offer a Free IT & Tech Roadmap Assessment to help you plan, prioritize, and start building the future you want for your team and your customers. 📧 sales@techstra.co | 📞 (385) 270-9170 One partner. One ecosystem. Limitless potential. Tomorrow’s tech is ready. The only question is: are you? Let’s get you there—without the enterprise price tag.

“Automation” gets thrown around a lot. It sounds futuristic and a little intimidating, like you’re about to hand your business over to a robot named Clippy with a grudge. But here’s the real deal: automation isn’t about replacing people. It’s about taking the boring, repetitive, soul-crushing stuff off their plate so they can actually do the work that matters. At Techstra Solutions, we help small businesses stop wasting time on tasks a script, workflow, or AI tool could handle in its sleep. (And yes, our automations do sleep.. just way less than your team.) 1. What Is Automation, Really? Think of it like this: When you get a calendar invite automatically from a scheduling link? That’s automation. When your invoices send out on the first of the month without you lifting a finger? Automation. When you onboard a new employee and all their accounts magically appear? Also automation. It’s not about robots. It’s about workflows. Digital dominoes that fall exactly the way you want; on time, every time. 2. What Can Automation Actually Do for You? Here’s a short list of things small businesses can automate right now : Employee onboarding (email, accounts, permissions.. done) Recurring client emails and follow-ups Invoice creation and reminders CRM updates from form submissions Ticket routing and task assignment Password reset workflows (bye forever, “Can you reset my login?” emails) Even internal reporting and productivity tracking The results speak for themselves: Less manual clicking. More actual doing. 3. So, What’s the Payoff? Let’s get blunt: Time saved = more hours for real work (or lunch breaks that aren’t sad and rushed) Money saved = fewer hours wasted, fewer mistakes to fix Frustration saved = employees don’t feel like they’re stuck in a Groundhog Day loop Processes enhanced = things run smoother, faster, and with fewer “oops” moments And here’s the twist: it’s not just about efficiency. Smart automation makes your business feel bigger, more polished, and way more capable. 4. The Truth About Automation: It’s Not a Magic Wand We’ll be real— not everything should be automated. Your customer onboarding call? That needs a human. A sensitive email about service delays? Definitely human. Hiring decisions? Please, for the love of good judgment, human. The secret is knowing what to automate and what to leave human. That’s where we come in. 5. How to Get Started Without Losing Your Mind Here’s what we recommend for businesses just getting started with automation: Identify your top 3 most repetitive tasks Pick a goal (time saved, reduced errors, faster delivery) Use tools like n8n, Microsoft Power Automate, or Zapier—or let us set it all up for you Monitor the results. Tweak what doesn’t work. Brag about your new free time to your team (they’ll love/hate you for it) We Make Automation Effortless At Techstra, we don’t just throw tools at you and call it a day. We: Audit your business processes Recommend the right automations for your workflow Build, test, and deploy them Provide support if anything breaks or needs tweaking Bottom line: You get the benefits of automation without needing to learn a single line of code—or give up control. Want a Peek at What You Could Automate? Let’s talk. Our Free IT Assessment includes a process automation audit—no strings, no pressure, just insight into how your business could run smoother, faster, and happier. 📧 sales@techstra.co | 📞 (385) 270-9170 One partner. One ecosystem. Way less repetitive clicking. Don’t work harder. Automate smarter. (And give your team something better to do than “copy/paste.”)
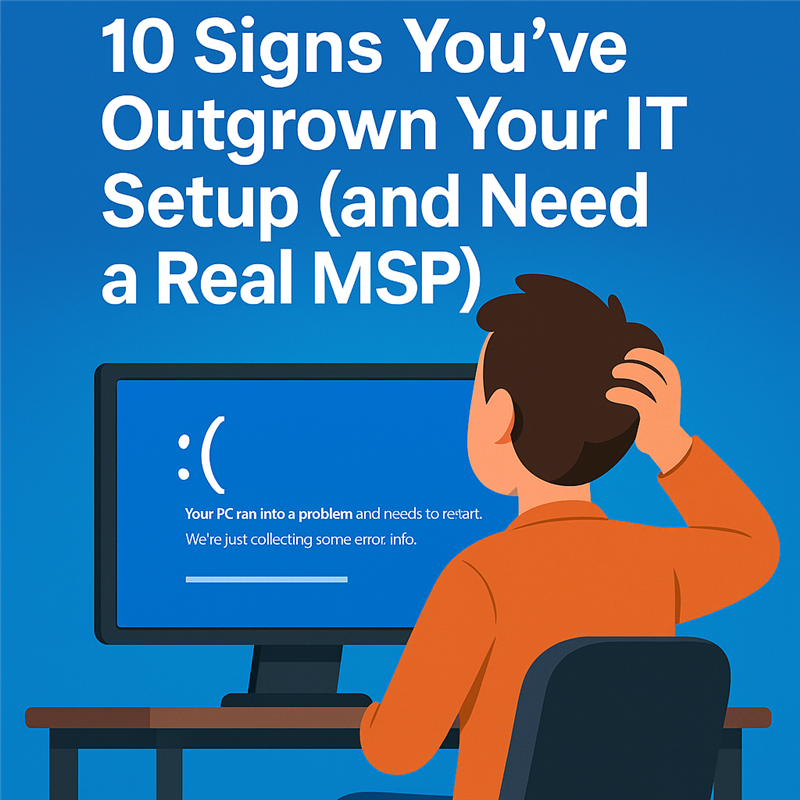
10 Signs You’ve Outgrown Your IT Setup (and Need a Real MSP)

Let’s play a quick game of “spot the red flag”: Your team spends half the morning rebooting laptops. Karen’s still waiting on someone to reset her password from last week. Nobody’s sure who manages the Wi-Fi: “Isn’t that something Steve set up in 2019?” Your current IT provider responds… eventually. Maybe. If you email them twice and light a candle. If any of that hits too close to home, it’s time to upgrade. Not your hardware, but your IT game . At Techstra Solutions, we specialize in turning slow, frustrating, duct-taped-together tech situations into sleek, secure, well-oiled machines. And yes, your employees will notice. So will your bottom line. 1. Managed Services = Managed Chaos (In the Best Way) Without an MSP, you’re playing tech roulette: Will today be a normal workday or a full-blown printer-induced meltdown? With the right MSP (hey, that’s us), you get: Helpdesk support that’s actually helpful Devices that stay updated before they break Networks that run like clockwork Security that works 24/7, not “whenever Bob checks the logs” IT systems aligned to your actual business goals It’s like adding an IT department without needing to build one from scratch or bribe a sysadmin with energy drinks. 2. Productivity Boosts That Actually Show Up on Your P&L Let’s break it down: Less downtime = more work done Fewer tech issues = fewer distractions Faster support = less time waiting, more time crushing goals Standardized tools & training = smoother onboarding and workflows Proactive monitoring = catching problems before they go DEFCON 1 The result? A team that actually wants to work because tech isn’t slowing them down every five minutes. 3. The ROI Isn’t Just in Numbers (But Also, It Is) Sure, better uptime and productivity mean more money in your pocket. But the real magic? Happy employees. Nobody likes tech friction. It kills morale. It makes smart people feel stuck. And it’s a fast track to burnout. When everything works , your team can do what they were actually hired to do, and they’ll thank you for it. 4. What We Bring to the Table (Besides the Fire Extinguisher for Your Current IT Dumpster Fire) At Techstra, we’re not just putting out fires; we’re building systems that don’t ignite in the first place. Our managed services include: Email, endpoint, and network management VoIP and collaboration systems that work anywhere Productivity tools and automation to save you hours per week Cloud strategy and data backups that actually back things up Friendly, local experts who know your business (and answer the phone) 5. Not All MSPs Are Created Equal Some MSPs just patch things. Others partner with you. We help you plan long-term, scale smart, and turn your tech from a daily headache into a powerful business tool. Whether you’re growing fast or just trying to get your Mondays back, we’ve got your back. Want to See What We’d Change First? Book a Free IT Assessment and we’ll give you a peek under the hood - no pressure, no jargon, just real answers and smart recommendations. 📧 sales@techstra.co | 📞 (385) 270-9170 One partner. One ecosystem. A lot more getting done. Productivity doesn’t have to be a dream. It just needs the right IT team behind it. Let’s make tech work for your team—not against them.

Let’s be honest: cybersecurity doesn’t exactly scream fun . It’s not flashy. It doesn’t come with RGB lights. And no one ever brags, “Check out my awesome firewall rules!” But here’s the thing: in 2025, good cybersecurity is the difference between a thriving business and a very expensive, very stressful disaster. At Techstra Solutions, we’ve seen what happens when small businesses think, “We’re too small to be a target.” Spoiler: You’re not. Hackers don’t discriminate; they automate. Let’s dig into what’s happening in the wild west of cybercrime, what it’s costing real businesses, and what you (and your MSP) should be doing about it. 1. The State of Cybersecurity: It's Wild Out There Cyber threats have evolved faster than your uncle’s conspiracy theories. We’re not just talking about viruses and spam emails anymore. We’re talking: Ransomware-as-a-Service (yes, that’s a thing) Phishing kits sold on the dark web AI-generated spear phishing emails so convincing even your IT guy gets nervous Credential stuffing , zero-day exploits , and drive-by downloads It’s a digital warzone, and your business is in the crosshairs. 2. The Price of Getting Breached? Not Pretty. Let’s talk numbers (deep breath): $120,000+ – The average cost of a cyberattack for small businesses 43% of all cyberattacks target small businesses 60% of small businesses go out of business within 6 months of a major breach Ransomware payments alone can range from $10,000 to over $1 million, depending on how unlucky you are Let’s not even get into the cost of downtime, lost customers, compliance penalties, or reputation damage. You really can’t slap a price tag on chaos—but your accountant will try. 3. Real-World Horror Stories (That We Didn’t Make Up) A small law firm in Colorado was hit with ransomware in 2023, paid $150,000 in Bitcoin, then had to rebuild their entire system from scratch. A medical clinic in Utah lost access to all patient data for three days—and was fined over $75,000 for HIPAA violations. A construction company in Idaho? One bad phishing email. $250K wire transfer gone. Poof. They all thought, “It won’t happen to us.” It did. 4. How MSPs Like Us Save the Day (And Your Bacon) That’s where Techstra Solutions comes in. We don’t just install antivirus and call it a day. We build layered, smart, and proactive security systems that actually work. Here’s what we do for our clients: 🔐 24/7 SOC Monitoring – Real-time alerts, threat triage, incident response 🛡️ Endpoint Detection & Response (EDR) – Stops ransomware in its tracks 📨 Phishing Simulation & User Training – Turn your team into your first line of defense 🚨 Security Patch Management – We patch, so you don’t get burned 🧪 Vulnerability Scanning & Reporting – Know your risks before the bad guys do 📁 Backups & Recovery Plans – Because Plan B should exist before disaster strikes We’re not paranoid—we’re prepared. 5. What You Should Do (Like, Now) If your current cybersecurity setup consists of “a password nobody could guess” and “hoping for the best,” it’s time for an upgrade. Step one? Know where you stand. That’s why we offer a Free IT & Cybersecurity Assessment - no strings, no pressure, just smart insight into your current environment and how to lock it down. Step two? Let’s build a security plan that makes sense for your business; your size, your budget, your goals. Let’s Lock It Down 📧 sales@techstra.co | 📞 (385) 270-9170 One partner. One ecosystem. No breaches. No panic. Remember: It’s not about if you’ll be targeted. It’s about whether you’re ready when it happens. (And we’re really, really good at making sure you are.)
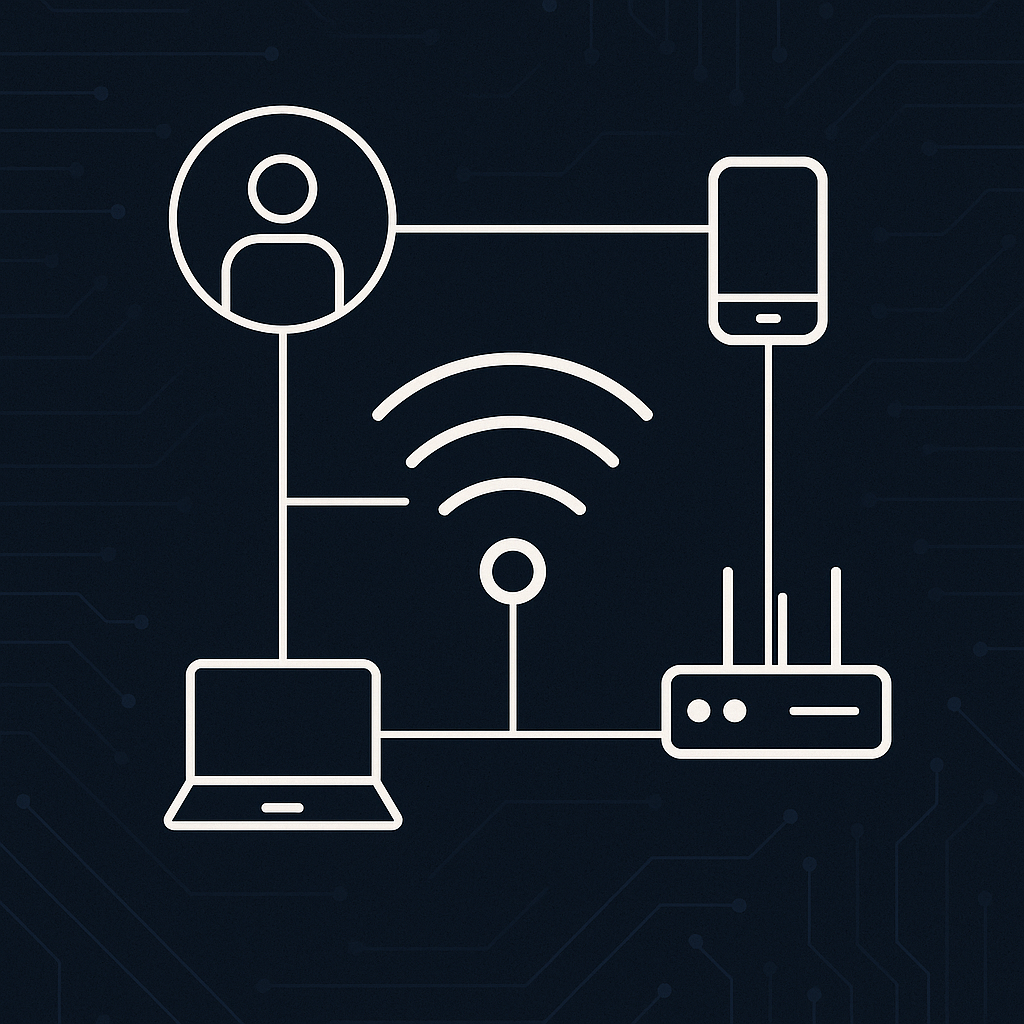
Let’s talk about your network gear, the unsung hero of your business (until it isn’t). If your office router is the same one your intern bought from a clearance shelf in 2017, we need to talk. At Techstra Solutions, we’ve seen it all: the blinking lights of doom, the random “my internet just died” Slack messages, and the classic IT ritual of unplug it, wait 10 seconds, plug it back in . Spoiler: that’s not a strategy. That’s a stall tactic. Here’s why investing in enterprise-grade networking gear—and having pros manage it—is the business equivalent of switching from a flip phone to a smartphone. Yes, it costs more up front. But the payoff? Massive. 1. Downtime Is Expensive (And Silent) When your network goes down, productivity doesn’t just pause, it does a full-on faceplant. Employees can’t work, calls drop, systems glitch, and suddenly Karen from accounting is threatening to quit because she can’t email a spreadsheet. And guess what? That’s not just annoying. That’s lost revenue . Pro Tip: Every minute of downtime has a cost. Every hour? Multiply that by your team size and your hourly payroll. Oof. 2. Cheap Gear = Expensive Problems We get it—there’s a thrill in saving $200 on a router. But those budget boxes are built for home streaming, not supporting an entire team’s cloud apps, VoIP calls, VPN traffic, and that one guy who insists on streaming lo-fi beats all day. Cheap gear fails. Mid-grade gear chokes under pressure. And when it does? You’re stuck troubleshooting it yourself or paying someone (us, probably) to emergency-fix it. Wouldn’t you rather just avoid the chaos? 3. Managed Networks: Your Set-It-and-Forget-It IT Dream With Techstra’s Managed Network Services , we take the whole networking mess off your plate: Enterprise-grade switches, firewalls, and access points 24/7 monitoring and alerting Proactive maintenance and firmware patching Bandwidth optimization (because yes, Karen is still streaming lo-fi beats) Secure remote access and segmentation for hybrid teams Think of it like having a network butler—one who never sleeps, never misconfigures VLANs, and never needs a performance review. 4. The ROI? It's Hiding in Plain Sight Sure, the upfront cost might sting a little. But that’s short-term pain for long-term gain. Fewer outages = more billable hours Proactive support = fewer “surprise” invoices Better hardware = longer lifespan, fewer replacements Stronger security = less chance of a $100K ransomware “oops” Happier users = fewer helpdesk tickets (and meltdowns) You make more money, waste less time, and sleep better at night. That’s a pretty good return. 5. Be Honest—Are You Really Managing That Network? If your network “management” consists of praying it holds together until 5 p.m., or calling your cousin who once built a gaming PC, we can help. At Techstra, we build networks that just work ; with built-in resilience, real-time visibility, and expert support baked in. So you can focus on growing your business… not crawling under desks rebooting the Wi-Fi. Let’s Talk We offer a Free IT Assessment that includes a network health check, risk analysis, and upgrade roadmap. No pressure. No jargon. Just smart advice from people who know what they’re doing.. and who don’t think Cat6 is a meme. 📧 sales@techstra.co | 📞 (385) 270-9170 One partner. One ecosystem. Zero network drama.
If hearing “artificial intelligence” still makes you think of talking robots and a dystopian future. Good news: it’s way less I, Robot and way more I finally got my life together . Especially for small businesses. At Techstra Solutions, we help real companies (with real humans) harness AI tools that make everyday work smoother, smarter, and way less stressful. Here's how your scrappy team can punch above its weight using technology that’s smarter than your average spreadsheet. 1. AI That Writes, Sorts, and Thinks (So You Don’t Have To) Email chains, meeting notes, task lists.. AI can now handle that digital chaos for you. Microsoft 365 Copilot and other tools can summarize meetings, rewrite emails, and even tell you (gently) that your calendar is too full. Instead of spending 30 minutes writing a follow-up, let AI write it while you go find your missing AirPods. Again. 2. Cybersecurity That Doesn’t Sleep (Because You Should) Small businesses are big targets for cybercrime. Why? Because most of them don’t have a security team—and hackers know it. That’s why our AI-powered Security Operations Center works 24/7/365. It spots weird behavior, blocks shady activity, and alerts you before things go full meltdown. Bonus: It doesn’t need coffee, PTO, or a motivational poster to keep working. 3. Customer Support That Sounds Like a Genius (Without Being One) Want your customer service to be fast, helpful, and not sound like a robot from the ‘90s? AI can help with that too. With tools like smart VoIP systems and virtual receptionists, you can: Route calls automatically to the right person (even if “the right person” is on lunch) Transcribe voicemails instantly Respond to common questions before they turn into support tickets Think of it like having your own version of K.I.T.T. from Knight Rider, but instead of sassily talking to David Hasselhoff, it’s handling inbound calls with charm, precision, and just the right amount of smug intelligence. What the means for you: More help for your customers, fewer interruptions for your team. 4. Business Intelligence That Doesn’t Require an MBA Let’s face it—data is great, but digging through reports isn’t anyone’s favorite task. AI tools can now surface insights, spot red flags, and even give you suggestions before you’ve had your first coffee. Think of it like a really smart intern who never calls in sick and always knows where the bottlenecks are. 5. The Techstra Technology Ecosystem: Because Herding Cats Isn’t a Strategy Our clients don’t need 10 different vendors or a degree in IT to make things run smoothly. With our Techstra Technology Ecosystem , we tie your systems together like a high-functioning group chat: Email, users, endpoints—all managed Network and cloud, fully monitored Phones that work (and work smart) 24/7 security that doesn’t freak out at 3 a.m. A strategy roadmap so you’re not just winging it Ready to Get Started? Let’s be real—tech is complicated, but working with us isn’t. We offer a Free IT Assessment that gives you clarity, confidence, and probably a few “ah-ha!” moments. 📬 Hit us up at sales@techstra.co or call (385) 270-9170. We promise no jargon, no pressure, just answers. One partner. One ecosystem. No more tech headaches. Let’s make AI your favorite employee.